I run a self-hosted media server at home, Jellyfin for movies and TV, Immich for photos, Paperless for documents, and a handful of other services. For a long time I had no real visibility into what any of it was doing. If something broke, I’d find out when it stopped working. So I decided to fix that with a real observability stack.
The Goal
- Metrics: CPU, memory, disk, network, and GPU utilization over time
- Logs: aggregated from all containers in one place
- Alerts: that actually reach me when something goes wrong
- Auto-recovery: containers that restart themselves without my intervention
The Stack
Everything runs as Docker containers managed by a single docker-compose.yml. The architecture is:
- Prometheus for metrics collection and storage
- Grafana for dashboards and visualization
- Node Exporter for host-level metrics (CPU, memory, disk, network)
- cAdvisor for container-level metrics
- DCGM Exporter for NVIDIA GPU metrics (I have an RTX 3060 doing hardware transcoding in Jellyfin)
- Loki + Promtail for log aggregation
- Alertmanager for alert routing and delivery
- Uptime Kuma for HTTP health checks
- Autoheal for automatic container recovery
What I Learned Along the Way
Loki Needs More Config Than the Docs Suggest
The first time Loki started, it immediately crashed with:
CONFIG ERROR: invalid compactor config: compactor.delete-request-store
should be configured when retention is enabled
Loki 3.x added a requirement that delete_request_store be explicitly set when retention is enabled. One line fix, but it took a bit of digging:
compactor:
  retention_enabled: true
  delete_request_store: filesystem
Promtail Will Try to Replay Years of Logs
When Promtail first starts, it reads Docker log files from the beginning. My Kimai container had logs going back to October 2025. Loki rejected all of them as too old, generating hundreds of error lines per second.
This is mostly harmless. Promtail advances through the backlog and eventually catches up to current logs. The fix is to configure explicit reject_old_samples in Loki so the behaviour is intentional rather than accidental.
The Loki Image Has No Shell
This was unexpected. The Grafana Loki image is distroless - no shell, no wget, no curl, no netcat. This makes writing a Docker health check interesting since every standard approach fails with “executable file not found.”
After trying several approaches I settled on just removing the health check from Loki entirely and using service_started instead of service_healthy for its dependents. Autoheal handles genuine failures, making the strict health check more trouble than it’s worth.
cAdvisor Was Using 151% CPU
After getting everything running I imported the Docker container monitoring dashboard in Grafana and noticed cAdvisor sitting at 151% CPU - more than one full core, continuously.
This turns out to be a known issue on hosts with lots of filesystems. link to github issue My server runs ZFS datasets, snap mounts, and a bunch of Docker overlay file systems. cAdvisor was collecting metrics for all of them.
The fix was three flags:
command:
  - "--docker_only=true"
  - "--housekeeping_interval=30s"
  - "--disable_metrics=tcp,udp,percpu,sched,process"
CPU dropped from 151% to around 5% at steady state.
Grafana Datasource UIDs Are a Gotcha
When you import a community dashboard from grafana.com, the panels reference a datasource by the UID the original author had on their own Grafana instance. If your datasource has a different UID (which it will, because Grafana assigns them randomly when you add one through the UI), every panel shows up magenta with “datasource not found.”
The proper fix is to provision datasources via config file rather than through the UI, so you control the UID:
datasources:
  - name: Prometheus
    type: prometheus
    uid: prometheus
    url: http://prometheus:9090
With this in place, community dashboards just work on import since their expected DS_PROMETHEUS UID matches what you’ve defined.
Alert Delivery Needs to Be Set Up Before You Need It
I wrote alert rules early, but didn’t wire up Alertmanager until later. In the meantime those alerts were firing silently into nothing. For alert delivery I ended up using a Discord webhook, Alertmanager has native Discord support and it took about five minutes to set up. Create a webhook in your Discord server under channel settings, drop the URL in your .env, and critical alerts get routed to a dedicated channel. Simpler than dealing with SMTP auth restrictions.
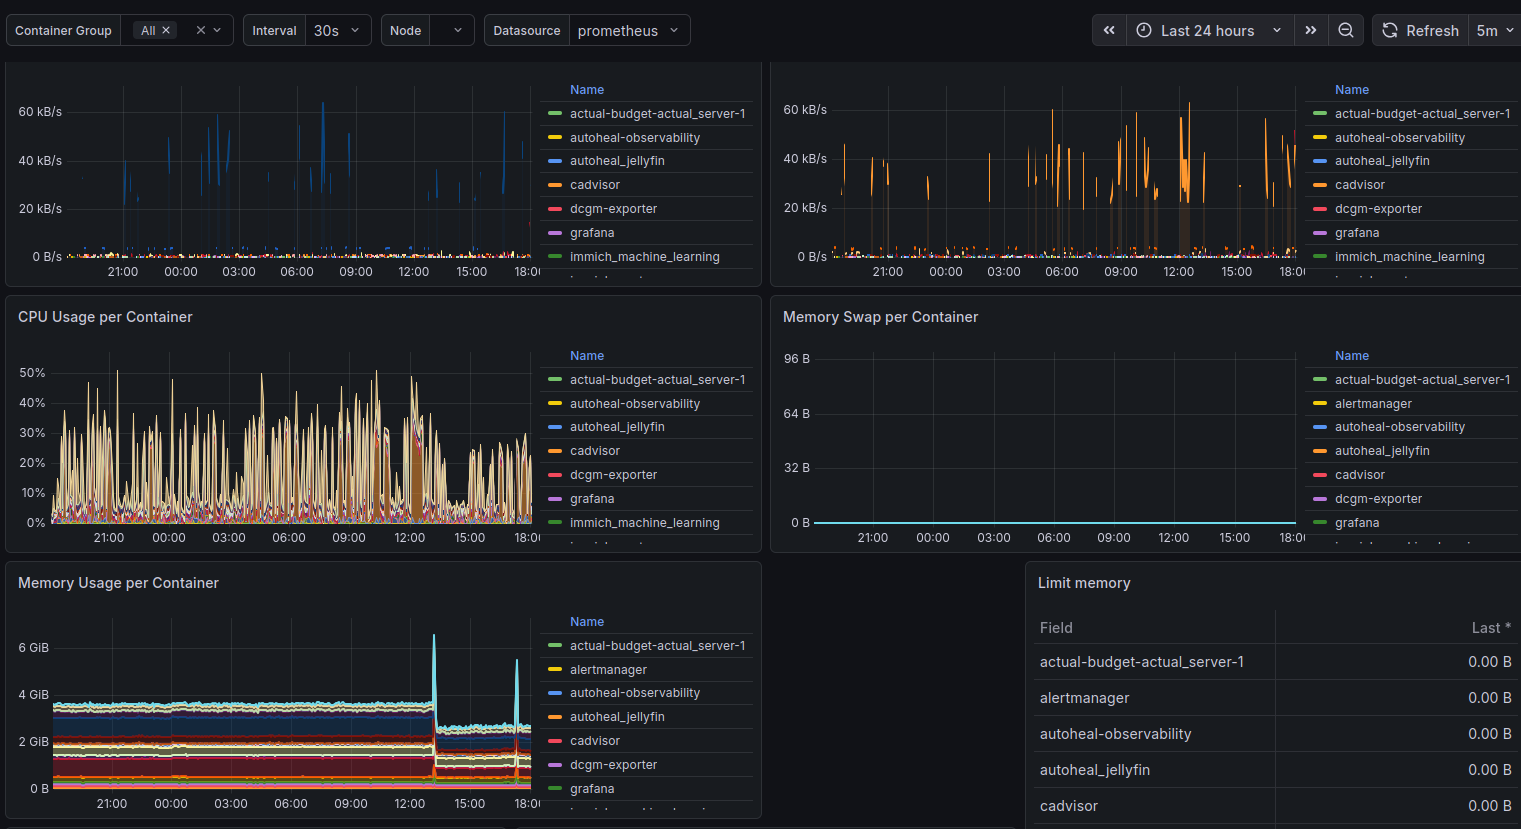
The ContainerHighMemory Alert Fires When Memory Limits Are Zero
After deploying the observability stack, nearly every container was triggering a ContainerHighMemory alert, despite memory usage being reasonable. The culprit was the alert rule itself:
expr: (container_memory_usage_bytes{name!=""} / container_spec_memory_limit_bytes{name!=""}) * 100 > 90
Without explicit mem_limit set in docker-compose, container_spec_memory_limit_bytes is zero, resulting in division by zero. The alert fires on every container with an unlimited memory allocation.
The fix is to add a guard clause:
expr: (container_memory_usage_bytes{name!=""} / container_spec_memory_limit_bytes{name!=""}) * 100 > 90 and container_spec_memory_limit_bytes > 0
Now the alert only evaluates containers that actually have memory limits defined. This is better than setting arbitrary limits on services that don’t need them, alert thresholds are only meaningful when you’re constraining the resource in the first place.
The GPU Story
One of the more satisfying parts of this project was getting proper GPU monitoring working. The RTX 3060 does hardware transcoding for Jellyfin via NVENC, and without visibility into it I had no way to know if it was being overloaded.
DCGM Exporter exposes detailed NVIDIA metrics to Prometheus: encoder utilization, decoder utilization, memory usage, temperature, power draw. Paired with the NVIDIA GPU Metrics dashboard in Grafana (ID 12239), it gives a complete picture of what the GPU is doing.
The health check for DCGM Exporter uses nvidia-smi directly:
healthcheck:
  test: ["CMD", "nvidia-smi"]
  interval: 30s
  timeout: 10s
  retries: 3
If the GPU runtime becomes inaccessible, nvidia-smi fails, Docker marks the container unhealthy, and Autoheal restarts it. The same pattern applies to Jellyfin itself, which has a health check that validates both GPU access and HTTP availability before reporting healthy.
What It Looks Like Now
Three Grafana dashboards cover mostly everything I care about:
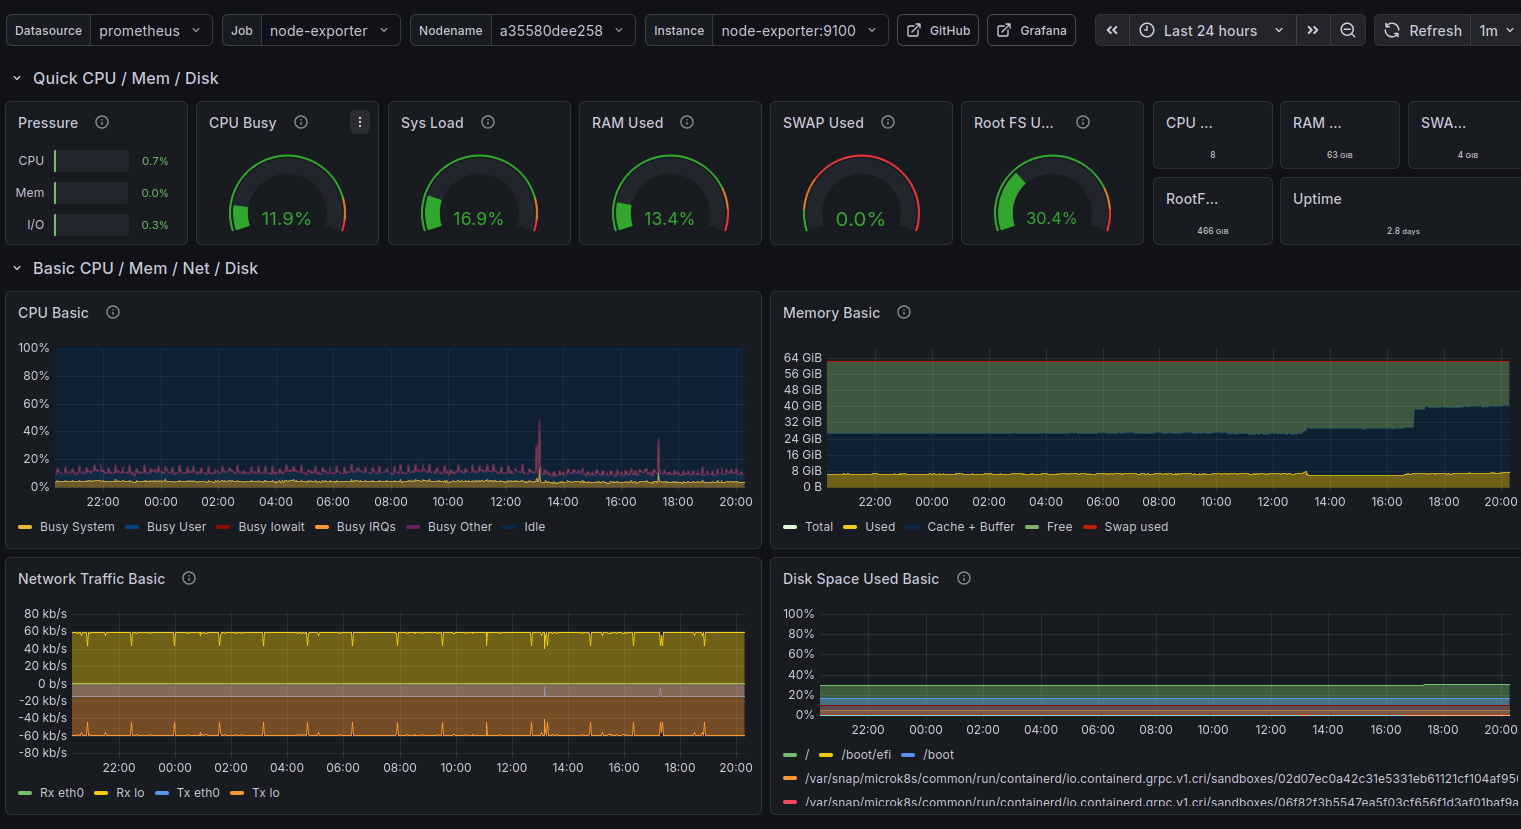
Node Exporter Full (1860) - host-level view of CPU, memory, disk I/O, network throughput, and system load. The single most useful dashboard for understanding what the machine is actually doing.
Docker Container Monitoring (893) - per-container CPU and memory, sent received traffic, and filesystem usage. This is where I first spotted cAdvisor misbehaving.
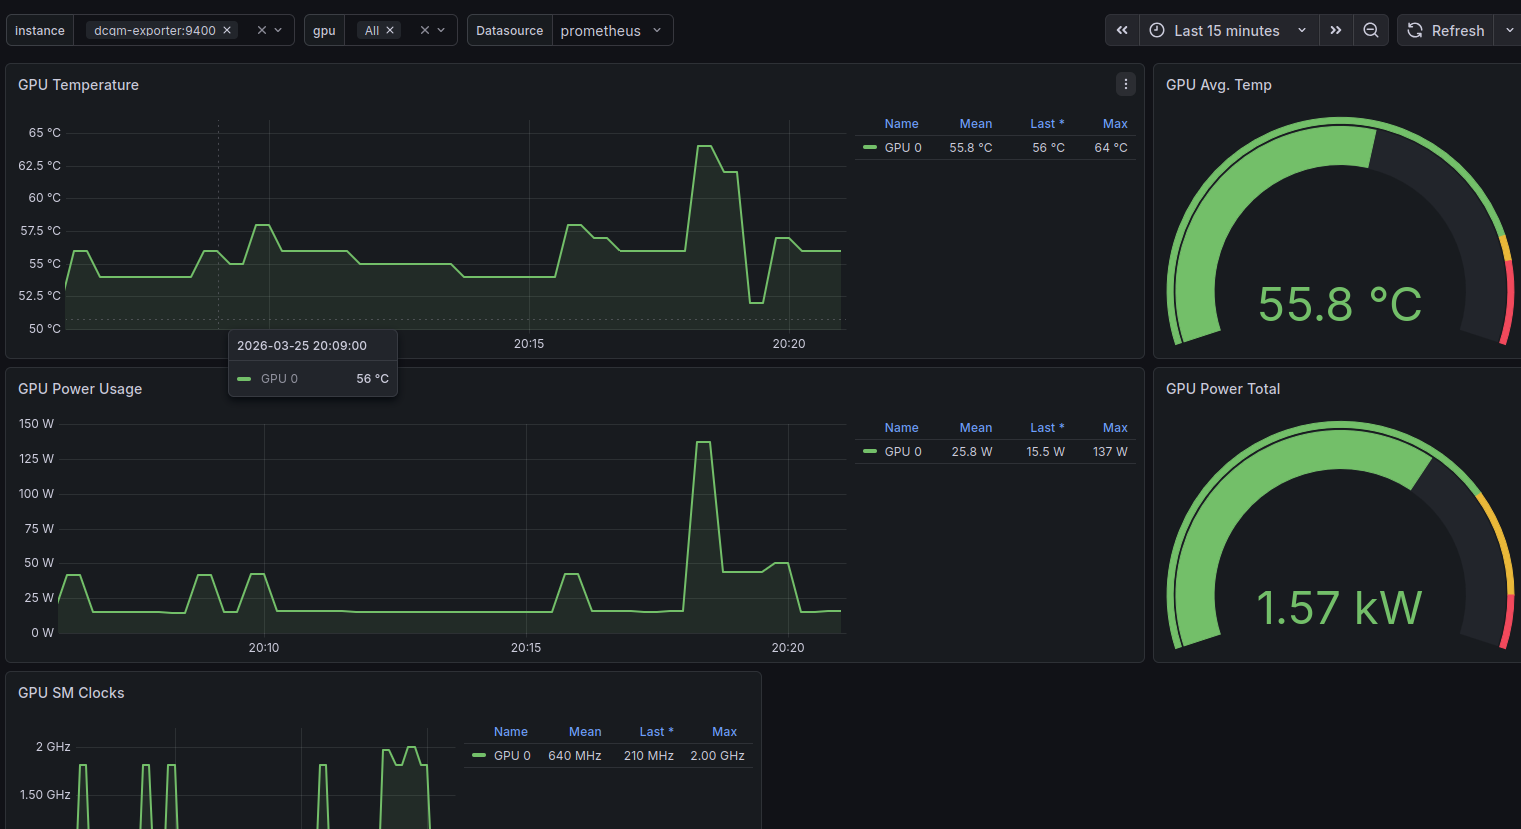
NVIDIA GPU Metrics (12239) - GPU SM Clocks, GPU Utilization, Framebuffer utilization, temperature, and power draw. Satisfying to watch during an active transcode.
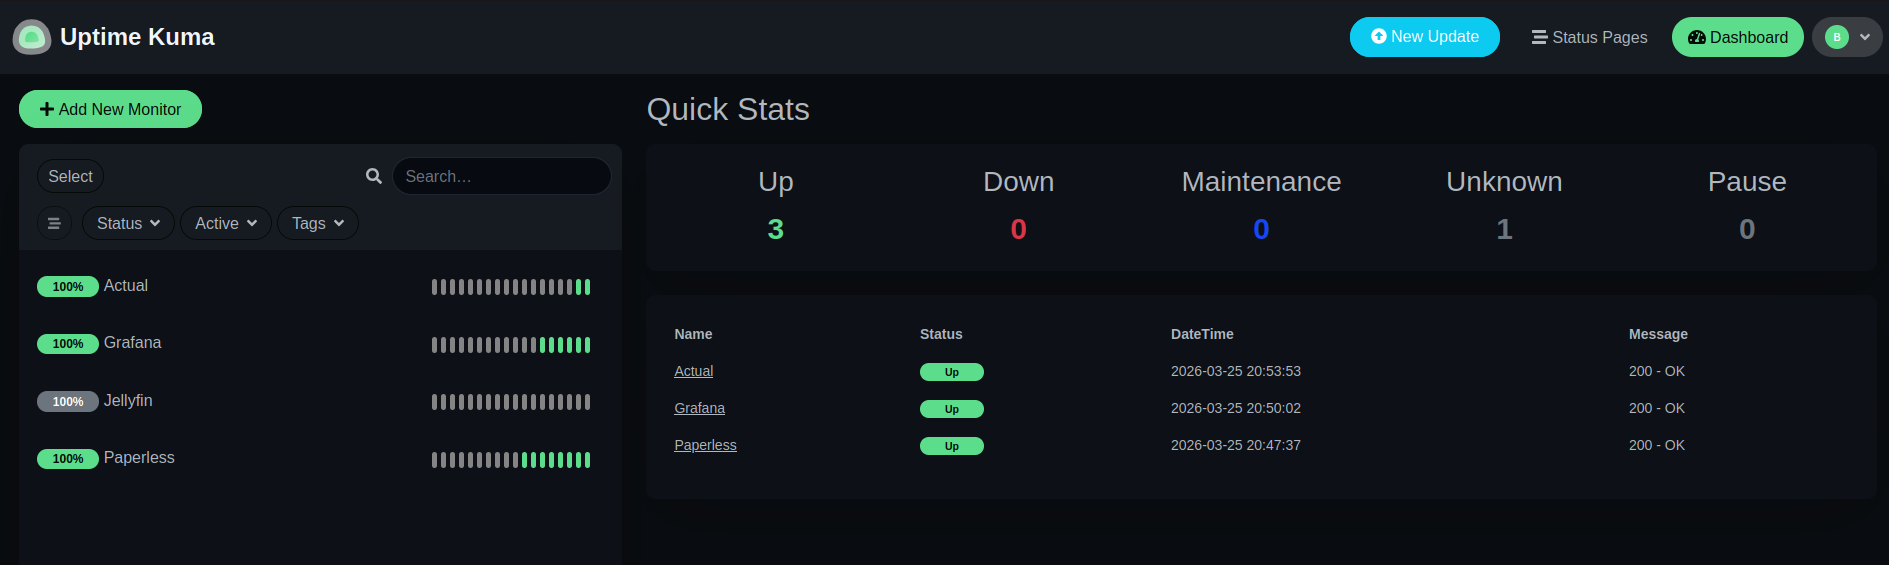
Uptime Kuma handles the HTTP-level checks separately - is Jellyfin responding? Is Grafana up? Is the reverse proxy working? These sit outside the Prometheus/Alertmanager chain by design: Uptime Kuma owns external reachability, Prometheus owns internal metric thresholds.
Closing Thoughts
The whole stack runs comfortably on a machine already running 20+ Docker services. Prometheus, Grafana, Loki, and the exporters together consume maybe 500MB of RAM and a fraction of a CPU core at steady state.
More importantly, I now know what my server is doing. I know the disk is at 40% capacity. I know the GPU idles at 55°C. I know cAdvisor briefly went rogue and used 151% CPU before I tuned it down. I know Kimai has been running since October without a restart.
That visibility is worth the afternoon it took to set up.
The full configuration - docker-compose.yml, Prometheus rules, Alertmanager config, Loki and Promtail configs - is available in the repository home-server-observability-stack.